Vue d'ensemble
Le projet
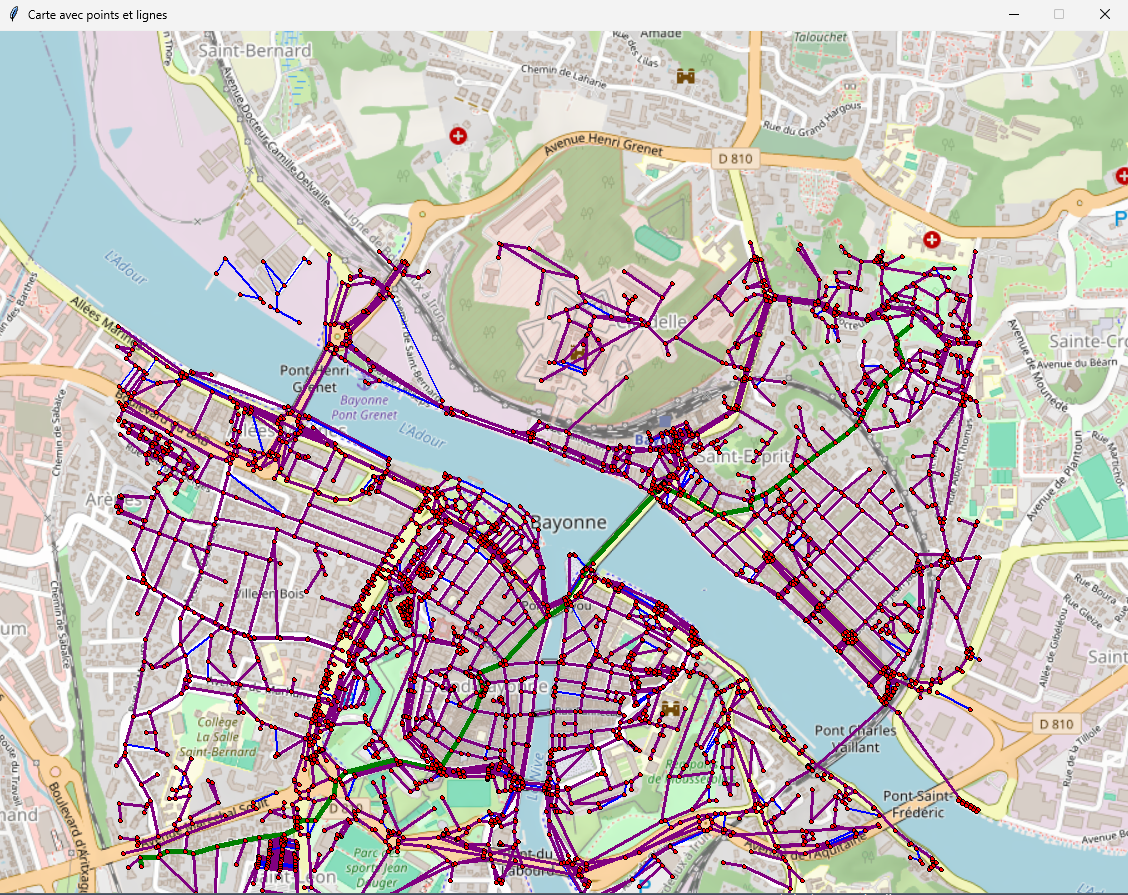
L'objectif de ce projet était de trouver le chemin le plus court entre plusieurs lieux de la ville de Bayonne. En utilisant la bibliothèque NetworkX, j'ai modélisé la ville sous forme de graphe, puis appliqué l'algorithme de Dijkstra pour déterminer le trajet optimal.
L'application propose également une visualisation étape par étape de la progression de l'algorithme sur une carte simplifiée de la ville, avec des couleurs différentes selon la distance parcourue.
Python 3
NetworkX
Matplotlib
Théorie des graphes
Voir sur GitHub